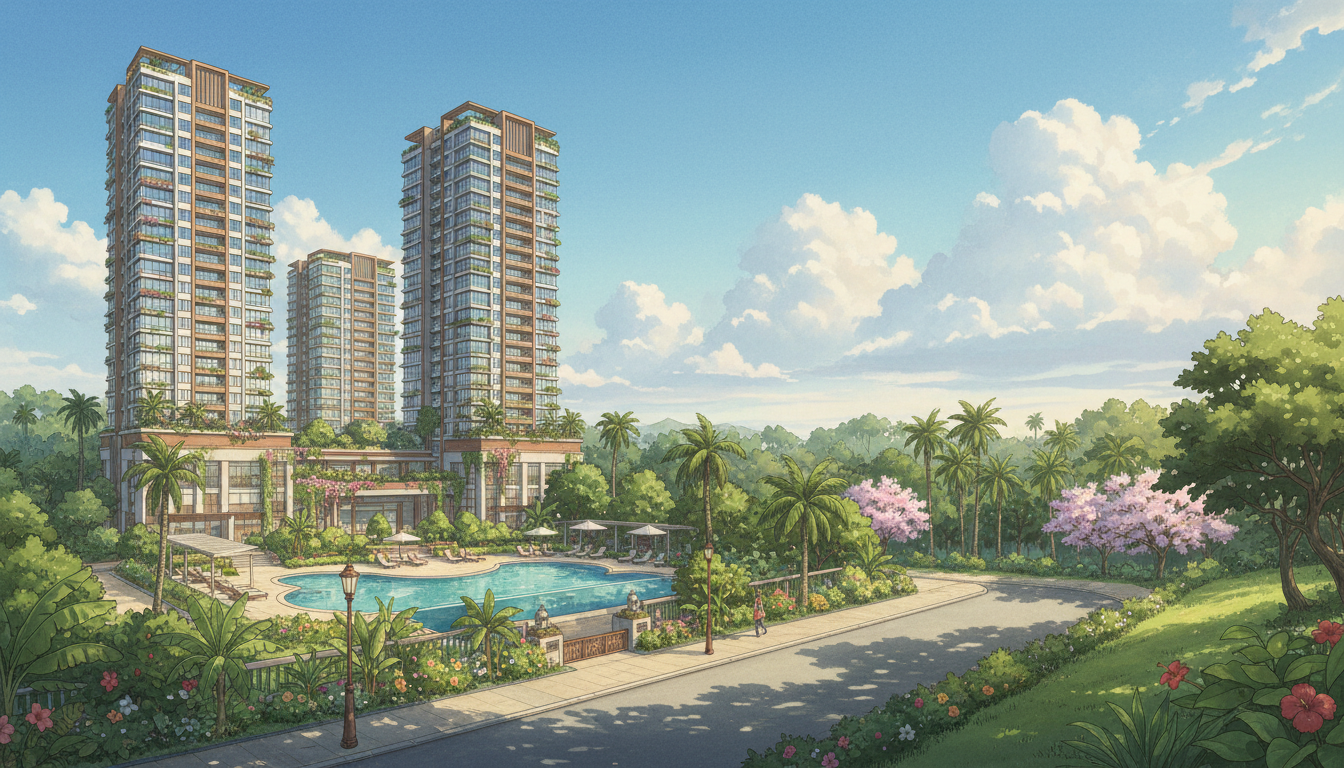
La Quinta Park at Chuan Walk in Singapore's District 19 offers a rare 999-year leasehold terraced house enclave with 51 spacious units, completed in 1993, ideal for families seeking suburban tranquility with urban access.[1]
This definitive Homejourney guide provides exhaustive insights into La Quinta Park, Chuan Walk, Singapore condo alternatives in D19, Serangoon-Hougang lifestyle, property investment potential, and condo prices. As your trusted partner prioritizing user safety and transparency, Homejourney verifies all data to empower confident decisions.
Table of Contents
- 1. Project Overview
- 2. Unit Types and Layouts
- 3. Facilities and Security
- 4. Location and Accessibility
- 5. Nearby Amenities
- 6. Price Analysis and Trends
- 7. Pros, Cons and Suitability
- 8. Investment Potential
- 9. Frequently Asked Questions
1. Project Overview
La Quinta Park is a premium 999-year leasehold terraced house development at 1-19 Chuan Walk, Singapore 558407, in District 19 (Serangoon, Hougang).[1][2]
Developed in 1993 with Temporary Occupation Permit (TOP) in the same year, it comprises 51 exclusive units, offering near-freehold security without full freehold premiums. This low-density enclave emphasizes family living in a serene, green setting.
District 19 blends residential charm with connectivity, home to HDB estates, private landed properties, and upcoming developments. Homejourney's verified data shows La Quinta Park as a standout for its spacious designs and quiet neighbourhood.[8]
| Key Project Details | Details |
|---|---|
| Address | 1-19 Chuan Walk, S558407 |
| District | 19 (Serangoon/Hougang) |
| Tenure | 999-year leasehold |
| TOP | 1993 |
| Total Units | 51 terraced houses |
Why Choose La Quinta Park in D19?
Its 999-year tenure mimics freehold benefits, with low maintenance fees typical of landed properties. URA planning confirms its position in a mature estate with no major redevelopment risks.[1]
2. Unit Types and Layouts
La Quinta Park features spacious terraced houses, primarily 5-bedroom, 3-storey designs with huge private gardens, averaging 890 sqm land area per unit.[1][7]
Units boast high ceilings, private patios, and attic spaces for flexibility. Insider tip: Many owners customize ground floors for home offices or entertainment rooms, leveraging the generous layouts.
No standard floor plans are publicly mandated for landed properties, but Homejourney's analysis reveals consistent features like multiple car parks and outdoor spaces.[8]
- 5-Bedroom Terraced Houses: 3 storeys + attic, ~890 sqm land, huge gardens for pools or lanais.
- Customization Potential: Add smart home systems, audio setups, bedroom cabinets as seen in resale listings.[1]
- Family-Friendly: Spacious living areas suit multi-generational living common in Singapore.
For detailed floor plan visuals, view comprehensive analysis of La Quinta Park on Homejourney.[8]
3. Facilities and Security
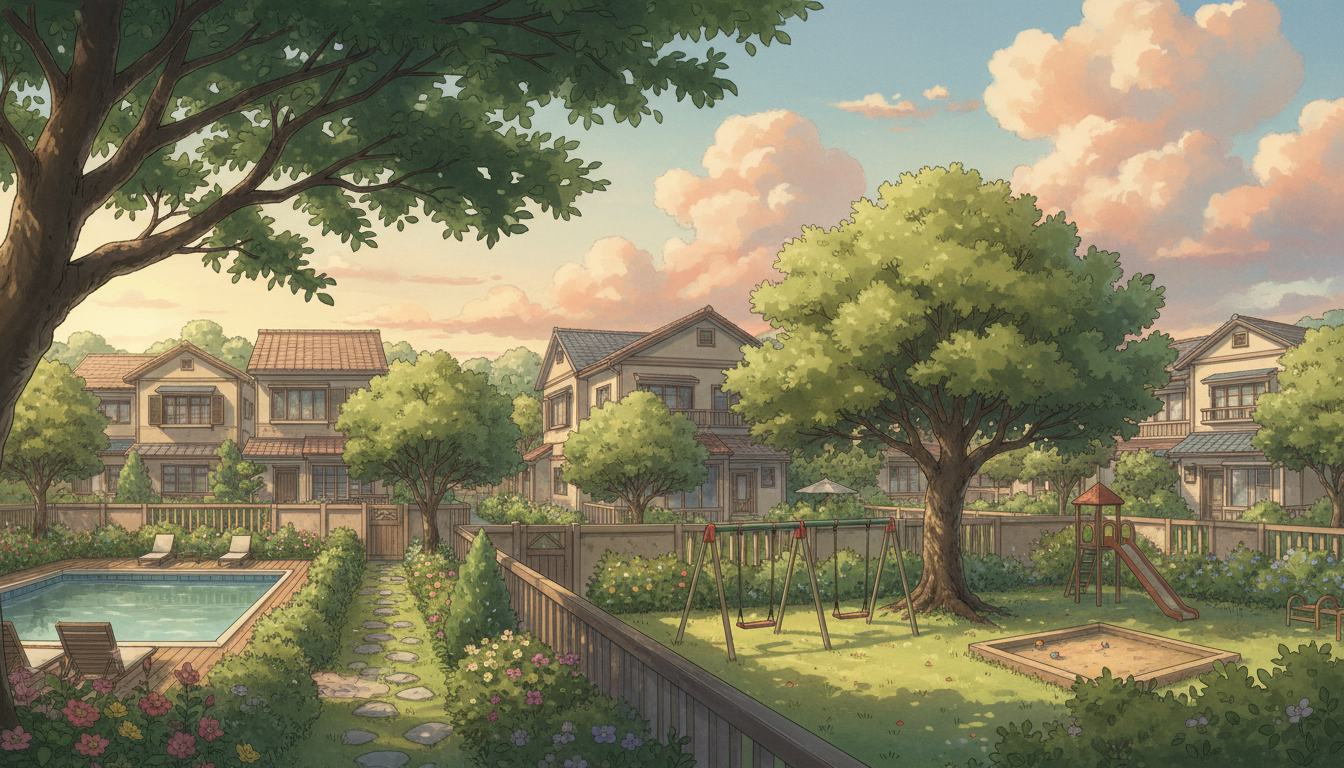
As a gated terraced enclave, La Quinta Park prioritizes privacy with private vehicle parks per unit and a communal children's playground.[1]
No shared condo-style facilities like pools or gyms, but each unit's garden enables personal additions like private pools. Security includes 24-hour neighbourhood watch, enhanced by D19's low crime rates per police statistics.
Practical advice: Residents often install CCTV and smart locks for added safety, aligning with Homejourney's user safety focus.
- Private car parks (1-2 per unit)
- Communal playground
- Garden spaces for BBQs/pools
- Quiet, low-density layout
4. Location and Accessibility
Strategically at Chuan Walk, La Quinta Park is 890m (11-min walk) from CC14 Lorong Chuan MRT and 1.3km from Serangoon MRT (CC13/NE12).[1][7]
Bus services along Upper Serangoon Road connect to CTE, PIE, and ECP, reaching CBD in 15-20 mins by car. Proximity to future Tavistock MRT (CR10) boosts future value.
| Transport | Distance/Walking Time |
|---|---|
| Lorong Chuan MRT (CC14) | 890m / 11 mins |
| Serangoon MRT (CC13/NE12) | 1.3km / 16 mins |
| CTE/PIE Expressways | 5-min drive |
LTA data confirms excellent connectivity; families appreciate the balance of suburbia and city access.[1]
5. Nearby Amenities
D19's amenities surround La Quinta Park, from hawker centres to international schools.[1]
Shopping and Dining
- NEX Mall, Junction 8 (10-min drive)
- Chomp Chomp Food Centre, Serangoon Garden Market (walking distance)
- myVillage, ICB Shopping Centre
Schools
- Zhonghua Primary, CHIJ Our Lady of Good Counsel (1-2km)
- Serangoon Garden Secondary, Yangzheng Primary
- Australian International School
Healthcare and Parks
- Garden Clinic, OneDoctors at NEX
- Bishan-Ang Mo Kio Park, Serangoon Stadium
For D19 lifestyle insights, see our Landed Housing Development Unit Types & Size Guide D19 | Homejourney . Local tip: Chomp Chomp's satay is a weekend staple for residents.
6. Price Analysis and Trends
As of 2026, La Quinta Park resales range from S$8.999 million for premium 5-bedroom units (~890 sqm land).[1][7] PSF averages S$10,000+, reflecting D19 landed premiums.
Historical trends show steady appreciation post-2020, driven by low supply. Homejourney's data indicates 5-7% y-o-y growth.[8] Disclaimer: Prices fluctuate; verify via Homejourney's La Quinta Park analysis.
Compare with D19 peers like The Florence Residences (condos at lower PSF).[1] Use our mortgage calculator for affordability.
7. Pros, Cons and Suitability
| Pros | Cons |
|---|---|
| Spacious gardens, privacy 999-year tenure Excellent schools/MRT Low density (51 units) | High entry price No shared facilities 11-min MRT walk Limited units availability |
Best for affluent families or investors seeking landed prestige. Not ideal for first-time buyers preferring condos.
8. Investment Potential
Strong capital growth from D19's family appeal and infrastructure like Circle Line extensions. Rental yields ~2-3% for sublets, high demand from expats near international schools.[1]
Liquidity solid in resale market; future Tavistock MRT enhances upside. See D19 analysis in Landed Housing Development Rental Yield Analysis: D19 Investment Returns 2026 . Homejourney recommends agents for tailored advice: Speak to a property agent.
Browse units: Search La Quinta Park listings.
9. Frequently Asked Questions
What is the tenure of La Quinta Park?
999-year leasehold from 1993, providing long-term stability.[1]
How far is La Quinta Park from MRT stations?
890m to Lorong Chuan MRT (11 mins walk), 1.3km to Serangoon.[1][7]
What schools are near La Quinta Park?
Zhonghua Primary, CHIJ Our Lady of Good Counsel, Australian International School within 2km.[1]
What is the price range for La Quinta Park in 2026?
Around S$8-10 million for 5-bedroom terraced houses; check Homejourney for latest.[1][8]
Is La Quinta Park good for families?
Yes, with playgrounds, gardens, top schools, and safe neighbourhood.[1]
How to finance a La Quinta Park purchase?
Use Homejourney's bank rates tool for loans up to 75% LTV for foreigners/55% for locals per MAS rules.
Homejourney ensures safe transactions with verified agents and transparent data. Start your journey today—search properties, analyze projects, and connect securely. For maintenance tips post-purchase, explore Aircon Services .