St Patrick's Green stands as one of District 15's most established residential developments, offering freehold living in a prime East Coast location. This comprehensive guide covers everything potential buyers and investors need to know about this boutique condominium, from unit specifications and pricing to neighbourhood amenities and investment potential. Whether you're a first-time homebuyer, upgrader, or property investor, this guide will help you make an informed decision about St Patrick's Green.
Project Overview & Development Details
Essential Project Information
St Patrick's Green is a freehold boutique condominium situated at 49 St Patrick's Road, Singapore 424167, in the heart of District 15.[2][3] The development was completed in 1999 and represents a well-established residential community that has maintained its appeal over more than two decades.[3] Unlike many newer developments, St Patrick's Green offers the security of freehold tenure—meaning residents own the land indefinitely with no lease expiry concerns.[2]
The development comprises a single 4-storey building with a total of 31 luxurious units, making it an intimate and exclusive residential community.[2][3] This smaller scale compared to larger condominium complexes contributes to a more personalised living experience and stronger sense of community among residents. The boutique nature of the development means lower density, more spacious common areas, and often easier access to facilities.
Developer & Track Record
St Patrick's Green was developed by established Singapore property developers with a strong reputation for quality residential projects. The development's completion in 1999 and its well-maintained condition over the past 25+ years demonstrate the developer's commitment to long-term quality and resident satisfaction. The property has consistently maintained its value and appeal in the competitive District 15 market.
Unit Types, Sizes & Floor Plans
Available Unit Types
St Patrick's Green offers two primary unit types designed to cater to different household sizes and lifestyle preferences:
| Unit Type | Size Range | Configuration |
|---|---|---|
| 2-Bedroom | 807 – 829 sqft | Master suite, guest bedroom, 2 bathrooms |
| 3-Bedroom | 1,087 – 1,130 sqft | Master suite, 2 guest bedrooms, 2 bathrooms |
2-Bedroom Units (807-829 sqft)
The 2-bedroom units at St Patrick's Green are ideal for young professionals, couples, and small families. With sizes ranging from 807 to 829 sqft, these units offer efficient layouts with a spacious master bedroom, guest bedroom, and two full bathrooms.[3] The living and dining areas are thoughtfully designed to maximise natural light and create a sense of openness despite the compact footprint. Many units feature patio access, providing residents with private outdoor space—a premium feature in District 15 condominiums.
3-Bedroom Units (1,087-1,130 sqft)
For families and investors seeking larger units, the 3-bedroom options provide substantially more space at 1,087 to 1,130 sqft.[3] These units feature a luxurious master suite with ensuite bathroom, two additional guest bedrooms, and a second full bathroom, making them suitable for families with children or those requiring home office space. The larger floor area allows for more generous living and dining spaces, while many units maintain the coveted patio feature that sets St Patrick's Green apart from comparable developments.
Unit Features & Design Highlights
St Patrick's Green units are characterised by their tropical design aesthetic with emphasis on natural light and ventilation. The patio feature is particularly noteworthy—many units include private outdoor spaces overlooking the development's landscaped gardens and water features, creating a resort-like atmosphere within the urban setting. High ceilings and open floor plans are standard, contributing to the spacious feel despite moderate square footage. The 4-storey building design means most units benefit from excellent natural light without the noise concerns sometimes associated with ground-floor living.
Facilities & Amenities
Residential Facilities
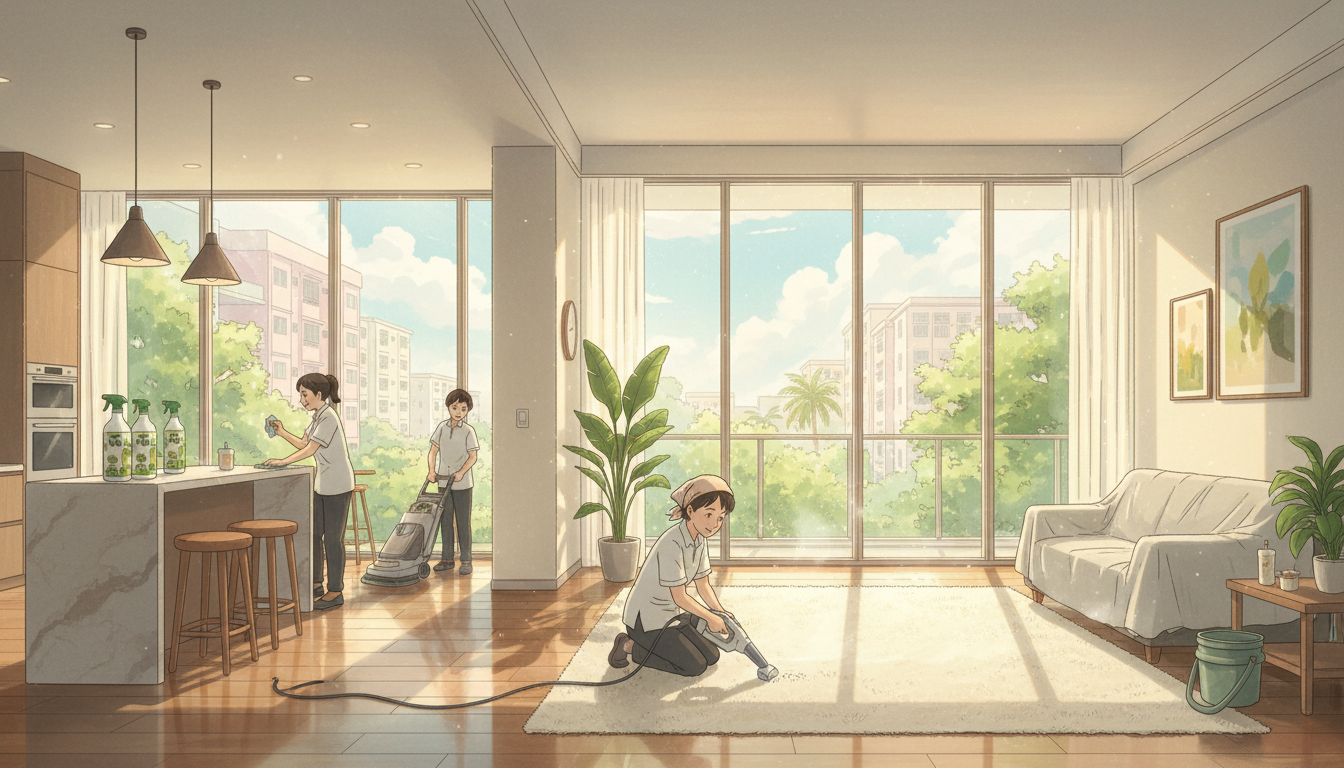
Despite its boutique size, St Patrick's Green offers a comprehensive range of facilities that rival larger developments. The condominium features a communal swimming pool—essential for tropical living and perfect for weekend recreation.[2] A well-equipped gymnasium provides residents with convenient fitness options without needing to join external clubs. The landscaped gardens and water features create a serene environment for relaxation and stress relief, particularly valuable given the development's proximity to busy Marine Parade Road.
Additional facilities include BBQ pits for social gatherings and entertaining, a children's playground for young residents, and a multi-purpose function room suitable for celebrations and community events.[2][4] Car parks are provided in basement levels, protecting vehicles from Singapore's intense sun and tropical weather while maximising ground-level space for greenery and recreation.[4]
Security & Safety Features
St Patrick's Green maintains 24-hour security with professional guards stationed at the entrance, providing peace of mind for residents and their families.[2][4] CCTV coverage throughout common areas and entry points ensures comprehensive surveillance. This commitment to security aligns with Homejourney's priority on creating safe residential environments where residents can feel confident in their investment and daily living.
Maintenance & Management
The development's well-maintained condition over 25+ years reflects professional management and regular upkeep. Common areas are regularly serviced, landscaping is professionally maintained, and facilities are kept in excellent working order. This attention to detail helps preserve property values and ensures a pleasant living environment for all residents.
Location & Accessibility
Strategic District 15 Location
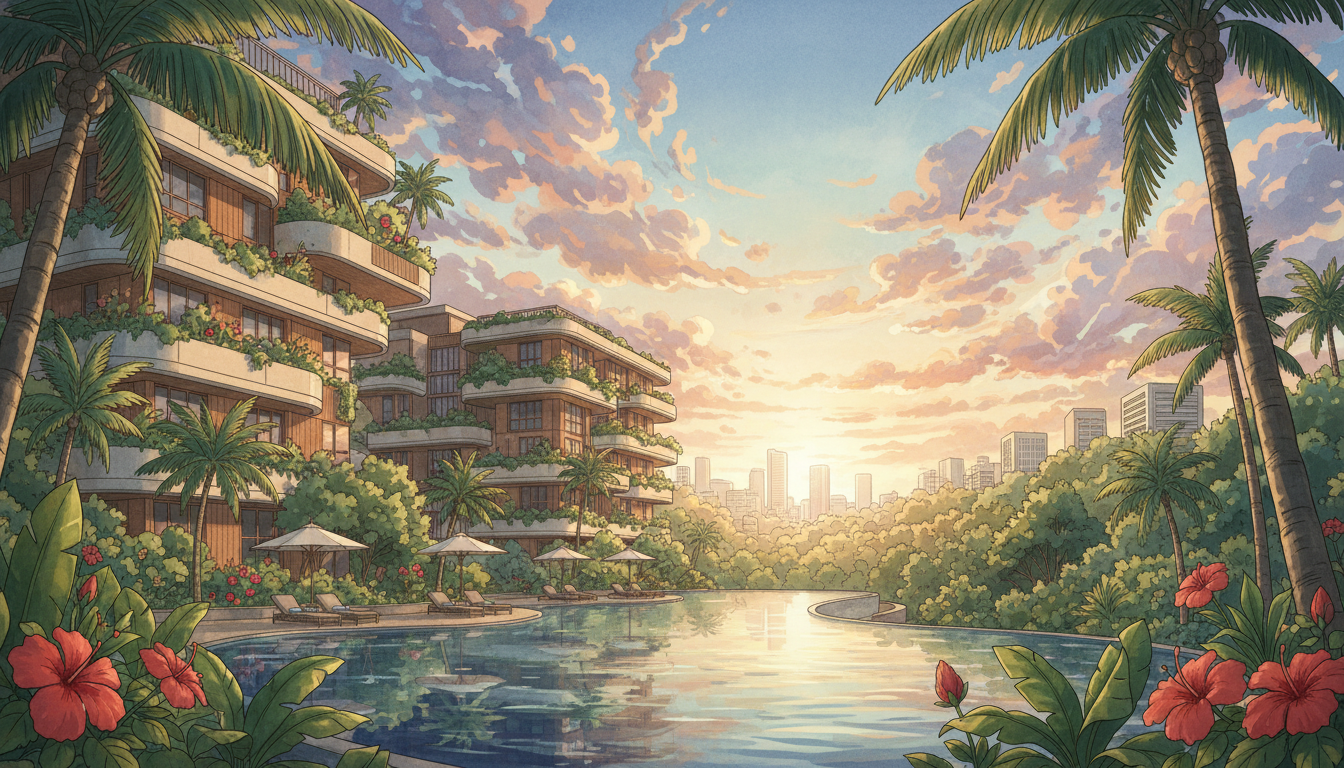
St Patrick's Green occupies a prime position in District 15, one of Singapore's most desirable residential neighbourhoods. District 15 encompasses the East Coast and Marine Parade areas, known for their perfect balance of urban convenience and coastal living. The location offers residents easy access to the Central Business District while maintaining proximity to recreational areas and a more relaxed lifestyle compared to central Singapore.
Public Transport Accessibility
The development benefits from excellent public transport connectivity, a critical factor for daily commuting and lifestyle convenience. The nearest MRT station is Marine Parade Station, located approximately 1.3 km away.[3] Other nearby stations include Kembangan (1.4 km away) and Eunos (1.74 km away), providing residents with multiple transport options.[2][3] For those using bus services, numerous bus stops are readily available along Marine Parade Road directly in front of the condominium, offering cross-island connectivity and frequent services throughout the day.[1]
The development is also well-positioned for upcoming transport improvements. Marine Terrace MRT Station, currently under development, will be within walking distance upon completion, further enhancing accessibility and property values.[1][7]
Road & Expressway Access
For vehicle owners, St Patrick's Green offers seamless connectivity via major expressways. The East Coast Parkway (ECP) and Pan Island Expressway (PIE) are readily accessible, enabling quick travel to various parts of Singapore.[2][3] The Central Business District and Orchard Road shopping district can be reached in approximately 15-20 minutes by car, making St Patrick's Green ideal for professionals working in central Singapore while preferring East Coast living.[2][3]
Nearby Amenities & Lifestyle
Shopping & Retail Options
Residents of St Patrick's Green enjoy access to abundant shopping options within walking distance or a short drive. The area features multiple shopping malls including 112 Katong, Katong Shopping Centre, Katong Square, Katong Plaza, Katong Mall, Parkway Parade, and Odeon Katong Shopping Complex.[3] These malls offer diverse retail experiences from fashion and electronics to dining and entertainment.
For daily groceries and essentials, several supermarket options are conveniently located nearby: Giant Express at Marine Terrace, Cold Storage and NTUC Fairprice at Parkway Parade, and Marks & Spencer also at Parkway Parade.[3] This abundance of shopping options means residents rarely need to travel far for everyday necessities or recreational shopping.
Dining & Food Options
The East Coast area is renowned for its exceptional dining scene, and St Patrick's Green residents benefit from this culinary abundance. The nearby 50A Marine Terrace Market is a neighbourhood food centre and wet market offering authentic local breakfast options such as nasi lemak and bee hoon, with approximately 25 stalls serving favourites like fishball noodles, wanton noodles, congee, and black carrot cake.[5] Additional food options include the 84 Marine Parade Central Market and Food Centre (1.3 km away), Eunos Crescent Market and Food Centre (2.5 km away), and the popular East Coast Lagoon Food Village (2.8 km away).[5]
Beyond hawker centres, the surrounding shopping malls feature numerous restaurants and eateries offering multicultural cuisines, from fine dining establishments to casual cafes.[2] The area's food scene caters to all preferences and budgets, making it an excellent location for food enthusiasts.
Parks & Recreation
East Coast Park is the crown jewel of recreation in this area, located less than 800 metres from St Patrick's Green.[1][2] As Singapore's largest outdoor recreation park, East Coast Park offers residents unparalleled access to beach activities, water sports, and coastal recreation. The park features a 15-kilometre stretch of beach perfect for cycling, with the sea breeze and ocean views providing a natural escape from urban living.[5]
The recently developed Coastal PlayGrove at Area B of East Coast Park is a family-friendly destination featuring the Play Tower—Singapore's tallest outdoor play feature with a 4-storey vertical net play area called the Vertical Challenge, plus slides on the third and fourth floors.[5] The nature play garden offers children opportunities to reconnect with nature and engage in spontaneous play. This makes East Coast Park particularly attractive for families with young children.
Additional recreational facilities in the vicinity include Marine Parade Community Club and Marine Parade Public Library (less than 800 metres away), providing cultural and recreational activities for residents.[1]
Educational Institutions
The area surrounding St Patrick's Green is well-served by educational institutions across all age groups. Within 1 km of the development, residents will find PCF Sparkletots (early childhood), CHIJ Katong Convent (primary and secondary), and Victoria Junior College.[1] The East Coast area has long been recognised as an excellent location for families prioritising education, with several well-regarded schools in proximity to the development.
Healthcare Facilities
Multiple clinics and healthcare facilities are located within 300 metres of St Patrick's Green, ensuring residents have convenient access to medical services.[1] This proximity to healthcare is particularly important for families with young children and elderly residents who may require regular medical check-ups.
Pricing & Market Analysis
Current Market Context (2026)
St Patrick's Green operates in a dynamic property market where pricing is influenced by multiple factors including location desirability, freehold tenure, unit size, condition, and broader market conditions. As of February 2026, the East Coast and Marine Parade areas remain highly sought-after locations, supporting stable property valuations. However, specific current pricing information requires consultation with qualified property professionals who have access to real-time market data.
Price Factors & Valuation Considerations
Several key factors influence St Patrick's Green property values:
- Freehold Tenure: The freehold status provides indefinite ownership with no lease expiry concerns, a significant advantage over leasehold properties and a key value driver.
- Location: Proximity to East Coast Park, shopping malls, and excellent transport connectivity commands premium pricing in District 15.
- Unit Size: 3-bedroom units typically command higher per-square-foot prices than 2-bedroom units due to demand from families and investors.
- Patio Access: Units with private patio spaces overlooking gardens are particularly valued and typically priced at a premium.
- Age & Condition: While the development was completed in 1999, professional maintenance has preserved its appeal. Well-maintained units maintain stronger values.
- Floor Level: Higher-floor units with better views typically command premium pricing.
- Market Conditions: Broader Singapore property market cycles, interest rates, and economic conditions influence pricing.
Rental Yield Potential
St Patrick's Green presents attractive rental yield potential for investors. The development's location near East Coast Park, shopping malls, and transport hubs makes it appealing to tenants seeking convenience and lifestyle amenities. The mix of 2-bedroom and 3-bedroom units allows investors to target different tenant segments—young professionals and couples for 2-bedroom units, and families for larger units.
The area's rental market is active, with consistent tenant demand driven by the neighbourhood's popularity. Investors should note that freehold properties often command rental premiums compared to leasehold alternatives, as tenants value the security of indefinite ownership and typically lower maintenance costs.
Financing & Mortgage Considerations
Most financial institutions readily provide mortgage financing for freehold properties like St Patrick's Green. The typical loan-to-value ratio for residential properties is around 75-80%, with repayment periods up to 30 years available. Current interest rates and financing terms should be discussed with your bank or mortgage broker. Homejourney's bank rates comparison tool can help you understand current financing options and calculate monthly payments based on different loan amounts and tenures.
Investment Potential & Market Outlook
Capital Appreciation Outlook
St Patrick's Green's location in District 15, combined with its freehold tenure and well-maintained condition, positions it well for long-term capital appreciation. The East Coast area continues to attract buyers and investors due to its lifestyle appeal, proximity to recreational facilities, and strong transport connectivity. Several factors support positive long-term appreciation prospects:
- Upcoming Transport Improvements: The Marine Terrace MRT Station, currently under development, will enhance transport accessibility and likely support property values upon completion.[1]
- Neighbourhood Development: Continued development in the East Coast and Marine Parade areas, including retail and recreational facilities, supports neighbourhood appeal and property values.
- Freehold Advantage: Freehold properties typically appreciate more steadily than leasehold properties as they avoid lease decay concerns.
- Supply Constraints: The limited number of units (31 total) means supply is constrained, supporting value retention and appreciation potential.
- Demographic Demand: Growing interest in East Coast living from both owner-occupiers and investors continues to support demand.
Resale Market Liquidity
St Patrick's Green's prime location and freehold tenure ensure strong resale market liquidity. Properties in this development typically attract buyer interest relatively quickly, though resale timeframes depend on pricing, market conditions, and unit-specific features. The boutique nature of the development means each property sale is significant within the community, and the limited total units mean each sale represents a notable transaction in the East Coast market.
Comparison with Neighbouring Developments
St Patrick's Green competes with other District 15 developments and nearby residential options. Its key competitive advantages include freehold tenure, boutique size offering intimate community feel, established reputation spanning 25+ years, and comprehensive facilities. Investors and buyers should compare St Patrick's Green with other District 15 options based on their specific priorities—whether prioritising price, unit size, facilities, or investment potential.
Pros, Cons & Suitability Assessment
Key Advantages
| Advantage | Benefit |
|---|---|
| Freehold Tenure | No lease expiry concerns; indefinite ownership provides security and long-term value retention |
| Prime Location | East Coast living with beach access, shopping, dining, and excellent transport connectivity |
| Boutique Development | Only 31 units create intimate community, lower density, and stronger sense of belonging |
| Established Track Record | 25+ years of proven quality maintenance and resident satisfaction |
| Patio Access | Private outdoor spaces in many units provide premium living experience |
| Comprehensive Facilities | Swimming pool, gym, BBQ areas, playground, and landscaped gardens |
| Transport Accessibility | Multiple MRT stations nearby; Marine Terrace MRT coming soon |
| Lifestyle Amenities | Proximity to East Coast Park, shopping malls, hawker centres, and schools |
Potential Considerations
- Limited Unit Availability: With only 31 units total, finding available units for purchase or rent may require patience and flexibility.
- Age of Development: While well-maintained, the development was completed in 1999, so some residents may prefer newer properties with modern smart home features.
- Smaller Unit Sizes: Compared to newer developments, unit sizes are relatively modest (807-1,130 sqft), which may not suit those requiring very spacious homes.
- Proximity to Main Road: Location near Marine Parade Road means some units may experience traffic noise, though this is mitigated by building design and landscaping.
- Limited Parking: As a boutique development, parking provisions are limited compared to larger complexes, which may be a concern for multi-car households.
Ideal Buyer & Investor Profiles
St Patrick's Green is particularly well-suited for:
- First-time Homebuyers: Seeking freehold properties with established track records, excellent location, and reasonable pricing compared to newer developments.
- Young Professionals & Couples: Attracted to 2-bedroom units, East Coast lifestyle, proximity to CBD, and vibrant neighbourhood amenities.
- Families: Valuing proximity to schools, parks (especially East Coast Park), and family-friendly amenities like playgrounds and recreational facilities.
- Property Investors: Seeking freehold properties with strong rental demand, capital appreciation potential, and established neighbourhoods with proven track records.
- Upgraders: Looking to move from HDB to private property while maintaining East Coast location and lifestyle preferences.
- Retirees: Seeking secure freehold properties in established neighbourhoods with good healthcare access and recreational amenities.
Frequently Asked Questions
General Questions About St Patrick's Green
Q: What is the tenure of St Patrick's Green?
A: St Patrick's Green is a freehold development, meaning residents own the land indefinitely with no lease expiry concerns. This is a significant advantage over leasehold properties and provides long-term security for homeowners and investors.
Q: How many units are there in St Patrick's Green?
A: The development comprises 31 units in a single 4-storey building, making it a boutique residential community with lower density compared to larger condominium complexes.
Q: When was St Patrick's Green completed?
A: St Patrick's Green was completed in 1999, making it an established development with over 25 years of proven quality maintenance and resident satisfaction.
Q: What unit types are available at St Patrick's Green?
A: Two primary unit types are available: 2-bedroom units (807-829 sqft) and 3-bedroom units (1,087-1,130 sqft). Both types are available with various configurations and many feature private patio access.
Location & Accessibility Questions
Q: What is the nearest MRT station to St Patrick's Green?
A: Marine Parade MRT Station is approximately 1.3 km away. Other nearby options include Kembangan (1.4 km) and Eunos (1.74 km). Additionally, Marine Terrace MRT Station is currently under development and will be within walking distance upon completion.
Q: How long does it take to reach the CBD from St Patrick's Green?
A: By car, the Central Business District can be reached in approximately 15-20 minutes via the East Coast Parkway or Pan Island Expressway, depending on traffic conditions.
Q: What bus services are available near St Patrick's Green?
A: Numerous bus stops are located directly in front of the development along Marine Parade Road, offering multiple bus services with cross-island connectivity and frequent daily services.
Q: Is St Patrick's Green suitable for families with children?
A: Yes, St Patrick's Green is excellent for families. The development offers a children's playground, proximity to several schools (PCF Sparkletots, CHIJ Katong Convent, Victoria Junior College), and direct access to East Coast Park with family-friendly facilities including the Coastal PlayGrove.
Amenities & Lifestyle Questions
Q: What facilities are available at St Patrick's Green?
A: The development features a communal swimming pool, gymnasium, landscaped gardens with water features, BBQ pits, children's playground, multi-purpose function room, and 24-hour security with CCTV coverage.
Q: How close is East Coast Park to St Patrick's Green?
A: East Coast Park is less than 800 metres away, making it easily accessible for residents. This provides exceptional recreational opportunities including beach activities, cycling, and the newly developed Coastal PlayGrove family destination.
Q: What shopping options are nearby?
A: The area features multiple shopping malls including 112 Katong, Katong Shopping Centre, Katong Square, Parkway Parade, and Odeon Katong. Supermarkets include Giant Express, Cold Storage, NTUC Fairprice, and Marks & Spencer.
Q: Are there hawker centres and restaurants nearby?
A: Yes, the area is renowned for its dining scene. The 50A Marine Terrace Market and 84 Marine Parade Central Market and Food Centre offer authentic local options, while nearby shopping malls feature diverse restaurants and eateries.
Investment & Financial Questions
Q: Is St Patrick's Green a good investment property?
A: St Patrick's Green presents attractive investment potential due to its freehold tenure, prime location, established track record, and strong rental demand in the East Coast area. The boutique nature and limited unit supply support value retention. However, investment suitability depends on individual investment objectives and market conditions.
Q: What is the rental yield potential for St Patrick's Green?
A: The development's location, amenities, and proximity to transport, shopping, and recreational facilities make it attractive to tenants. Freehold properties typically command rental premiums compared to leasehold alternatives. Specific yield calculations depend on current market rental rates and property condition.
Q: Can I get a mortgage for St Patrick's Green?
A: Yes, most financial institutions readily provide mortgage financing for freehold properties. Typical loan-to-value ratios are 75-80%, with repayment periods up to 30 years. Current interest rates and financing terms should be discussed with your bank. Homejourney's bank rates tool can help you compare current financing options.
Q: What are the property taxes and maintenance costs?
A: Property taxes (annual property tax) and maintenance costs (monthly sinking fund and management fees) vary. As a freehold property, St Patrick's Green residents own the land indefinitely, which typically results in lower long-term costs compared to leasehold properties. Specific cost information should be obtained from the management office or real estate professionals.
Buying & Selling Questions
Q: How do I find available units for sale or rent at St Patrick's Green?
A: Browse available units at St Patrick's Green