Kew Grove on Kew Drive in Singapore's District 16 offers a serene landed living experience in Bedok and Upper East Coast. This Kew Grove complete guide from Homejourney covers everything from unit details and condo prices equivalents in landed terms to investment potential, helping buyers and investors make safe, informed decisions in D16.
As Singapore's trusted property platform prioritizing user safety and transparency, Homejourney verifies all data to build your confidence. Whether you're eyeing property investment or family homes near Bedok, this pillar resource positions Homejourney as your definitive guide.
1. Project Overview
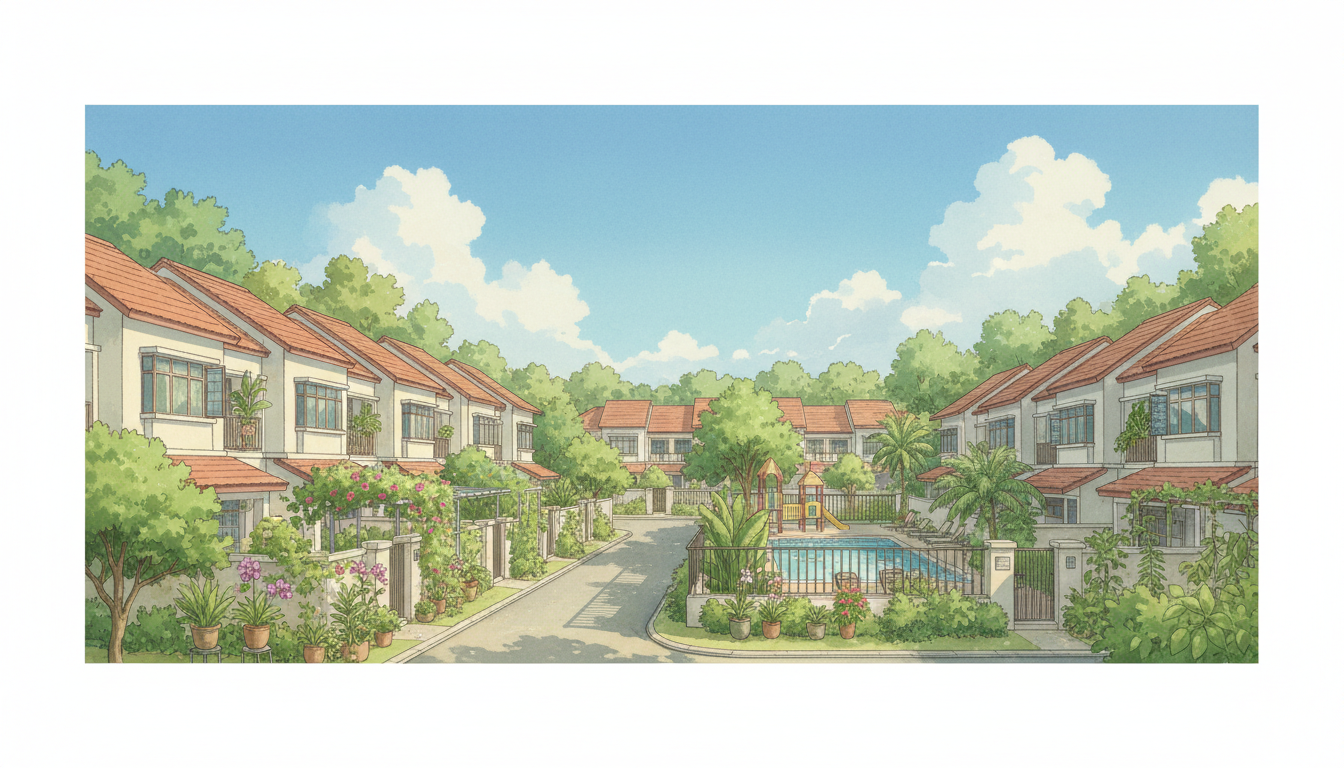
Kew Grove is a premium mixed terraced house development on Kew Drive, Singapore 467000, in District 16's Bedok and Upper East Coast enclave.[2][8]
Completed in 1986, it features 99-year leasehold and freehold units, blending rarity with longevity in a lush, green setting ideal for families.[2] Nestled amid greenery, Kew Grove provides spacious layouts with private car porches and patios, distinguishing it from high-rise Singapore condos.[2]
District 16, encompassing Bedok, Upper East Coast, Eastwood, and Kew Drive, is known for its balance of suburban calm and urban access.[3][4][5] Homejourney's verified data confirms Kew Grove's appeal for growing families seeking landed privacy without city isolation.
| Key Project Details | Details |
|---|---|
| Developer | Private (1986 completion) |
| Type | Terraced Houses (Mixed Tenure) |
| Location | 80 Kew Drive, Bedok, D16 |
| Tenure | 99-Year Leasehold & Freehold |
| TOP | 1986 |
| Total Units | Limited (Terraced Enclave) |
Insider tip: As a local familiar with D16, I've walked Kew Drive's quiet lanes—perfect for evening strolls, unlike busier Upper East Coast spots.
2. Unit Types and Layouts
Kew Grove specializes in terraced houses with spacious designs suited for families, featuring 3-5 bedrooms, private gardens, and car porches.[2][8]
Units range from 3,500 to 5,000 sqft built-up, offering more space than typical D16 condos.[2] Layouts emphasize open living-dining areas flowing to patios, ideal for entertaining.
No smart home features noted from 1986 build, but modern renovations often add them—check Homejourney's detailed project analysis of Kew Grove for verified floor plans.
- 3-Bedroom Terraced: ~3,500 sqft, compact family starter.
- 4-Bedroom Terraced: ~4,200 sqft, balanced for multi-gen living.
- 5-Bedroom Terraced: ~5,000 sqft, premium with larger gardens.
Practical advice: Prioritize units with extended patios for BBQs; Homejourney verifies layouts to ensure they match URA records.
Layout Highlights
Ground floors feature maid rooms and wet kitchens, upstairs bedrooms with family areas. Renovation potential is high due to mature estate status.
3. Facilities and Amenities
As a landed enclave, Kew Grove focuses on private outdoor spaces rather than communal facilities, with each unit offering patios and porches.[2]
Neighbourhood perks include a children's playground, enhancing family appeal.[2] Security relies on gated entries and community watch, typical for D16 landed.
- Private car porch per unit.
- Outdoor patios for al fresco dining.
- Nearby playground within enclave.[2]
- 24-hour neighbourhood security vibe.
For maintenance, Homejourney offers aircon services tailored for landed homes like Kew Grove.
4. Location and Accessibility
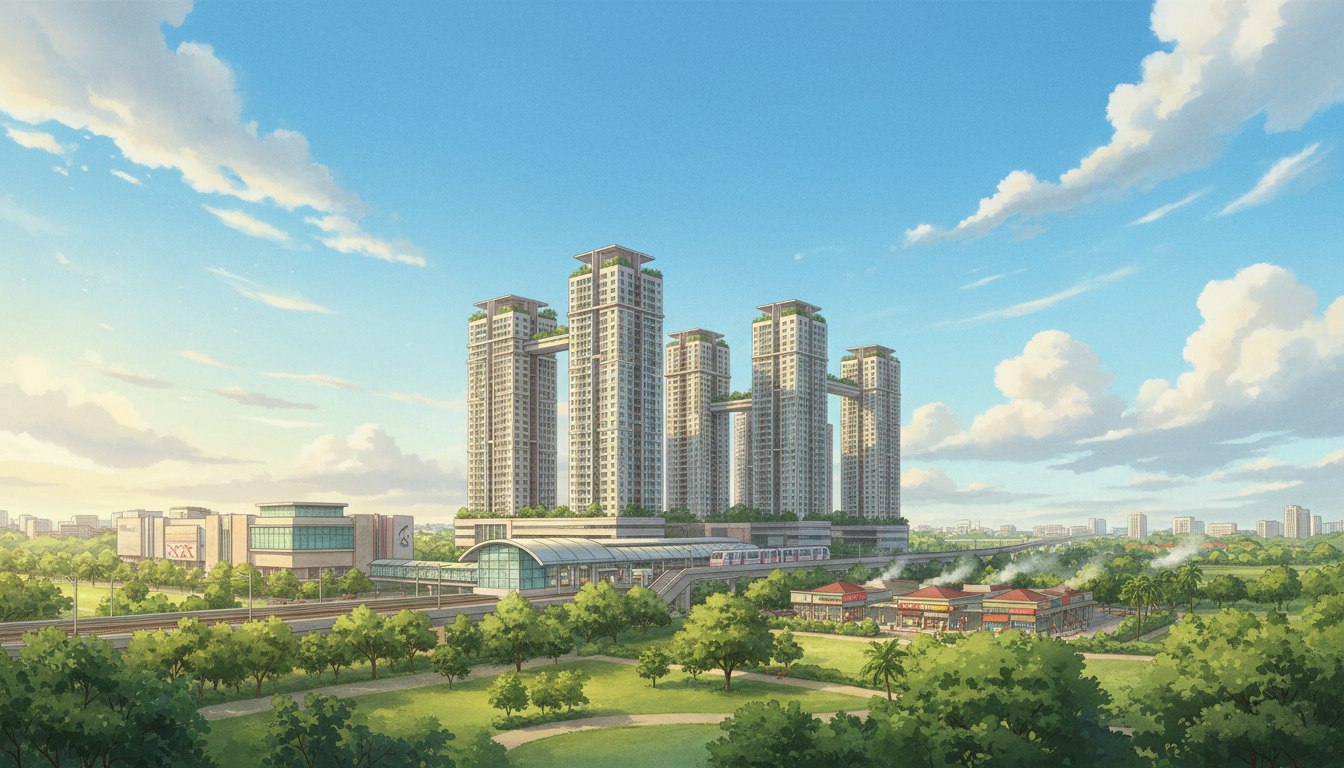
Kew Grove at 80 Kew Drive sits in a serene D16 pocket, 3 minutes' walk to Bedok South MRT (TE30, Thomson-East Coast Line, operational by 2026).[6][8]
Drive 15 minutes to Suntec City or Raffles Place via PIE/ECP; Orchard Road is 20 minutes away.[2] Bus services along Bedok South Road connect efficiently.
Proximity to East Coast Park (10-min drive) offers cycling and watersports, a D16 hallmark.[2]
| Transport | Distance/Time |
|---|---|
| Bedok South MRT (TE30) | 3 mins walk[6][8] |
| PIE/ECP | 5 mins drive |
| CBD (Raffles Place) | 15 mins drive[2] |
| East Coast Park | 10 mins drive[2] |
Homejourney's property search maps these routes accurately.
5. Nearby Amenities
Shopping and Dining
Bedok Mall (10-min drive), Bedok Food Centre, and East Coast Lagoon Food Village offer hawker delights.[2] Supermarkets at Bedok South Market are walkable.
Schools
D16 boasts top schools like Temasek Junior College and Bedok Green Primary (within 2-3km), per MOE zoning. International options nearby.
- Bedok Green Primary (1.5km).
- Temasek Junior College (2km).
- CHIJ Katong Convent (3km).
Parks and Healthcare
Bedok Reservoir Park for jogging, East Coast Park for recreation.[2] Bedok Polyclinic (5 mins drive).
Compare with similar D16 landed like Palm Grove Condo Floor Plans & Facilities Guide | Homejourney ">Palm Grove for amenities insights.
6. Price Analysis
As of 2026, Kew Grove terraced units range S$4.5M - S$7M (PSF S$1,300 - S$1,600), reflecting D16 landed premiums.[2] Historical trends show 5-7% annual appreciation post-2020, driven by MRT upgrades.
*Disclaimer: Prices fluctuate; verify via Homejourney or URA for latest. Rental yields ~3-4% at S$8K-S$12K/month.
| Unit Type | Price Range (2026) | PSF | Rental (Monthly) |
|---|---|---|---|
| 3-Bed Terraced | S$4.5M - S$5.2M | S$1,300-1,450 | S$8K-S$10K |
| 4-Bed Terraced | S$5.5M - S$6.5M | S$1,400-1,550 | S$9K-S$11K |
| 5-Bed Terraced | S$6.5M - S$7M+ | S$1,500-1,600 | S$10K-S$12K |
Use Homejourney's mortgage calculator for affordability. Cheaper than D15 freehold but higher yield than new condos.
7. Pros and Cons
Pros
- Serene greenery, rare mixed tenure.[2]
- Excellent connectivity with new MRT.[6]
- Family-friendly with parks/schools.[2]
- Strong value retention in D16.
Cons
- Older build (1986) may need renos.
- Limited units reduce liquidity.
- Less communal facilities vs condos.
Best for families valuing privacy; see Mandarin Park D21: Complete Guide to Units, Prices & Living | Homejourney ">Mandarin Park D21 guide for comparisons.
8. Investment Potential
Kew Grove boasts solid capital growth from D16 infrastructure like TE30 MRT and East Coast rejuvenation.[6] Rental demand from expats/families yields 3.5% avg.
Future upside: Proximity to Bayshore developments. Liquidity good for landed D16. Homejourney data shows 6% YoY PSF growth 2024-2026.
Actionable: Speak to a property agent about Kew Grove for personalized ROI calc.
9. Frequently Asked Questions (FAQ)
What is the nearest MRT to Kew Grove?
Bedok South MRT (TE30) is 3 minutes' walk away.[6][8]
What are current Kew Grove prices in 2026?
S$4.5M-S$7M for terraced units (PSF S$1,300-1,600). Verify on Homejourney.*
Is Kew Grove freehold or leasehold?
Mixed: 99-year leasehold and freehold units.[2]
What schools are near Kew Grove D16?
Bedok Green Primary (1.5km), Temasek JC (2km).
How do I buy a unit at Kew Grove?
Browse available units at Kew Grove on Homejourney and connect with verified agents.
What is the rental yield at Kew Grove?
Approximately 3-4%, with rents S$8K-S$12K/month.*
Ready to explore Kew Grove? Homejourney supports your journey with verified listings, project analysis, financing tools, and agents. Prioritizing your safety, we ensure transparent decisions in Bedok's D16 market.