Homejourney presents the definitive guide to Echelon for sale, the premier Singapore condo for sale in District 03 at Alexandra View. This 99-year leasehold development, completed in 2016, offers 508 luxury units across 41-43 storeys, blending urban sophistication with city-fringe convenience in Queenstown and Tiong Bahru.[1][2][5]
As Singapore's trusted property platform prioritizing user safety and transparency, Homejourney verifies all listings to help you buy condo with confidence. Whether you're a first-time buyer, upgrader, or investor eyeing D03 properties, discover available units, price trends, and insider buying advice here.
Table of Contents
- 1. Echelon Property Overview
- 2. Available Units for Sale at Echelon
- 3. Why Buy at Echelon
- 4. Echelon Price Analysis for Buyers
- 5. Location Advantages in District 03
- 6. Financing Guide for Echelon Buyers
- 7. Step-by-Step Buying Process
- 8. Investment Potential of Echelon
- 9. FAQ: Echelon For Sale
1. Echelon Property Overview
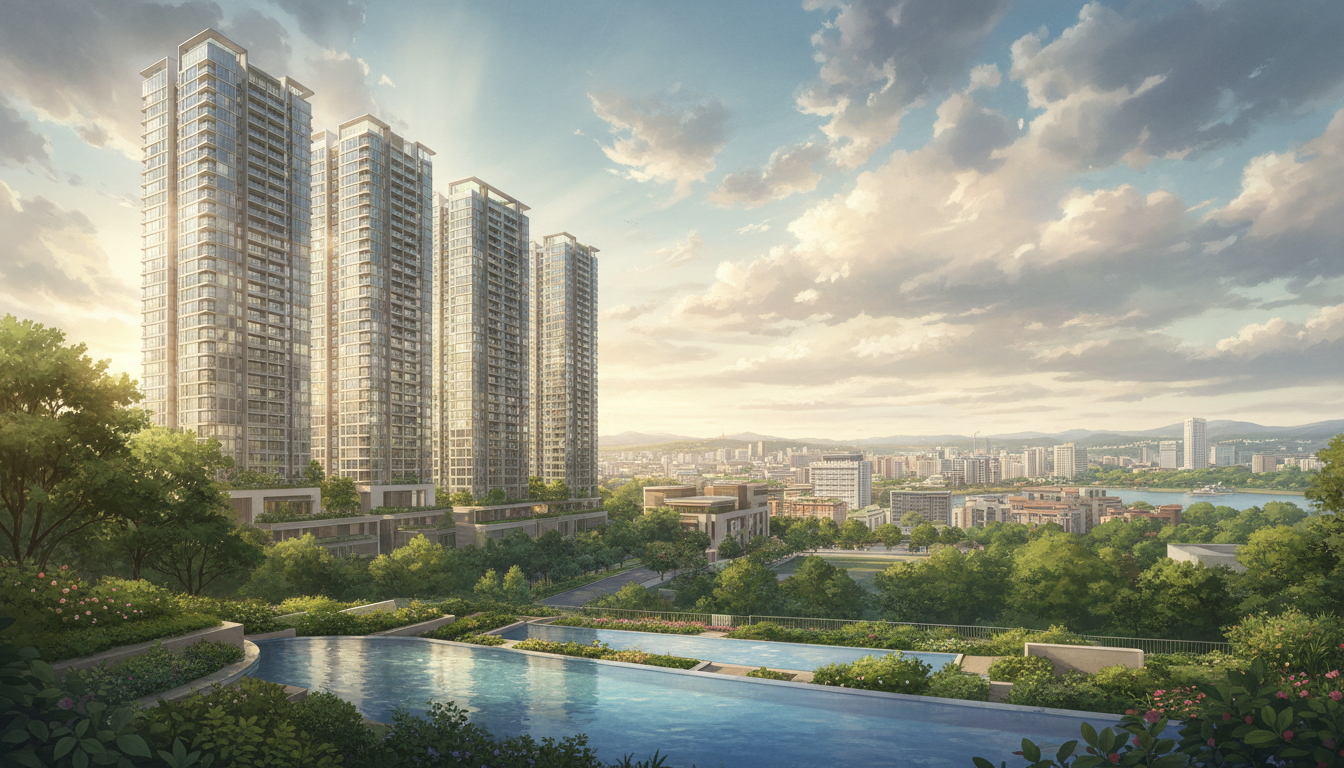
Echelon, developed by Freshview Developments Pte Ltd (a City Developments Limited subsidiary), stands at 5, 7, and 9 Alexandra View, Singapore 158741, in the heart of District 03.[2][5] This luxury condominium features three blocks rising up to 43 storeys with 508 residential units, completed in November 2016 on a 99-year leasehold tenure from March 2012.[1][2]
Designed by acclaimed SCDA Architects—known for Leedon Residence—Echelon boasts sleek facades, panoramic city views, and lush landscaped spaces.[2] Facilities include a swimming pool, gym, yoga deck, BBQ pits, 24-hour security, and over 513 carpark lots (including electric and handicap spots).[1] Residents enjoy an exclusive lifestyle with maximised space, modern kitchens, and premium finishes.
Why buyers love Echelon: Its prime city-fringe location offers CBD proximity without the premium price, appealing to professionals and families. Homejourney's verified data shows steady demand, making it a smart buy condo choice in Queenstown.[5]
Developer Reputation and Build Quality
Freshview Developments, backed by CDL, delivers high-quality projects with thoughtful design. Echelon's integration of luxury and functionality—airy lobbies, high-floor views—sets it apart. Insider tip: Higher floors (above 30) command premiums for unobstructed vistas towards the CBD.[2]
2. Available Units for Sale at Echelon
Echelon offers diverse unit types: 1-bedroom (around 500-700 sqft), 2-bedroom (850-1,100 sqft), 3-4 bedroom apartments (1,200-2,000 sqft), and rare penthouses up to 5-bedrooms.[2][4] Popular picks include 2-bedroom units, comprising 36% of recent activity for their balance of space and affordability.[4]
Current listings on Homejourney show active Echelon for sale options. Recent PSF ranges from S$1,840 (larger units) to S$2,763, with 1-2 bedroom units at S$2,200-S$2,500 psf.[2][4] Absolute prices: 1BR from S$1.1M, 2BR S$1.9M-S$2.5M, larger units up to S$3.2M (based on 2024 URA data; 2026 estimates similar with market uptick).[6]
| Unit Type | Size (sqft) | Price Range (2026 Est.) | PSF Range |
|---|---|---|---|
| 1-Bedroom | 500-700 | S$1.1M - S$1.6M | S$2,200 - S$2,500 |
| 2-Bedroom | 850-1,100 | S$1.9M - S$2.6M | S$2,300 - S$2,500 |
| 3-4 Bedroom | 1,200-2,000 | S$2.5M - S$3.5M | S$1,900 - S$2,400 |
| Penthouse | 3,000+ | S$5M+ | S$1,800 - S$2,100 |
Disclaimer: Prices are estimates based on recent URA transactions and market trends; actuals vary. View real-time available units on Homejourney.[4][5]
3. Why Buy at Echelon
Key selling points: Luxe facilities like landscaped pools and yoga decks, plus unblocked views from high floors. Lifestyle perks include a serene yet connected vibe—perfect for professionals commuting to CBD (10-15 mins drive).[2]
- Exclusivity: Only 508 units ensure privacy.
- Modern living: SCDA design with premium appliances.
- Family-friendly: Nearby parks and schools.
Original insight: Echelon's varying block heights create wind corridors, keeping units cooler naturally—a boon in humid Singapore. Upgraders appreciate the value over newer D03 launches.[2]
4. Echelon Price Analysis for Buyers
2026 PSF averages S$2,000-S$2,500, up from launch due to District 03 demand.[2][4] Historical appreciation: 5-7% annually post-TOP, outperforming RCR averages per URA data.
Compared to nearby: Echelon offers better value than freeholds like The Cosmopolitan (higher PSF), ideal for buy condo investors.[5] See detailed price trends on Homejourney.
| Comparison | Avg PSF (2026 Est.) | Tenure |
|---|---|---|
| Echelon | S$2,200-S$2,500 | 99-yr |
| Nearby D03 (e.g., Stirling Residences) | S$2,400-S$2,800 | 99-yr |
| Queenstown Freeholds | S$2,800+ | Freehold |
5. Location Advantages in District 03
Alexandra View places Echelon 5-10 min walk to Redhill MRT (EW18) Exit A or Tiong Bahru MRT (EW17).[1][4] Queenstown MRT (EW19) is 15 min away. AYE/DEP expressways link to CBD in 10 mins.
Amenities:
- Shopping: Alexandra Village (5-min drive), IKEA Alexandra (groceries).
- Schools (1km radius): Gan Eng Seng Primary, Queenstown Secondary, CHIJ Kellock (primary).[4]
Parks: Alexandra Park Connector (jogging), HortPark (10-min drive).
D03's mix of HDBs and condos fosters community; future Circle Line enhancements boost connectivity.[4] Insider tip: Tiong Bahru Market (heritage wet market) is a 12-min walk for authentic local eats.
6. Financing Guide for Echelon Buyers
For a S$2.2M 2BR unit, expect 25% downpayment (S$550K, CPF/eligible). LTV up to 75% for first-time buyers; monthly ~S$8K-S$10K at 3-4% rates (30-yr tenure).
ABSD: 0% for Singaporean first-timers, 17% for foreigners. Max CPF for housing: Check eligibility. Use Homejourney's mortgage calculator for precise estimates. Link to Bank Rates for latest rates.
| Unit Price | Downpayment (25%) | Est. Monthly (3.5% rate) |
|---|---|---|
| S$1.5M (1BR) | S$375K | S$5,700 |
| S$2.2M (2BR) | S$550K | S$8,300 |
| S$3M (3BR) | S$750K | S$11,300 |
Assumes 30-yr loan; consult professionals for personalized advice.
7. Step-by-Step Buying Process
- Search & Shortlist: Browse Echelon for sale on Homejourney.
- Viewings: Schedule with Homejourney agents.
- Offer & Option Fee: 1% of price (14-21 days validity).
- Financing: Submit to banks via Homejourney tools.
- Sale & Purchase: 25% stamp duty within 14 days; lawyer handles.
- Completion: 8-12 weeks; pay balance.
Homejourney ensures safe transactions with verified agents. See Projects Directory for more D03 insights.
8. Investment Potential of Echelon
Rental yields: 3-4% (2BR ~S$5K-S$7K/month), driven by expat demand near CBD.[4] Capital growth: 6% YoY projected with RCR uplift and Circle Line Stage 6 (2025+).[4]
- Tenant pool: Professionals from finance/tech sectors.
- Upside: Limited supply in D03 boosts appreciation.
Compare to 76 Shenton Price Trends & Market Analysis | Homejourney for similar trends. Strong for property investment.
9. FAQ: Echelon For Sale
What is the price of Echelon units for sale?
2BR units range S$1.9M-S$2.6M (S$2,300-S$2,500 psf) in 2026.[4]
Is Echelon near MRT?
Yes, 5-10 min walk to Redhill or Tiong Bahru MRT.[1]
What schools are near Echelon?
Gan Eng Seng Primary, Queenstown Sec within 1km.[4]
ABSD for Echelon purchase?
0% first Singaporean buyer; 17% foreigners. Use Homejourney calculator.
How to buy Echelon condo?
Search on Homejourney, view units, secure option. Full guide above.
Rental yield at Echelon?
3-4% based on recent data; high demand.[4]
Ready to explore Echelon for sale? View available units, use our mortgage tools, or contact agents. Homejourney prioritizes your safety with verified listings and transparent support—start your property journey securely today.